DA-bench
Visual Benchmark for Data Analytics AI Agents
Question V2:
Charting with two series
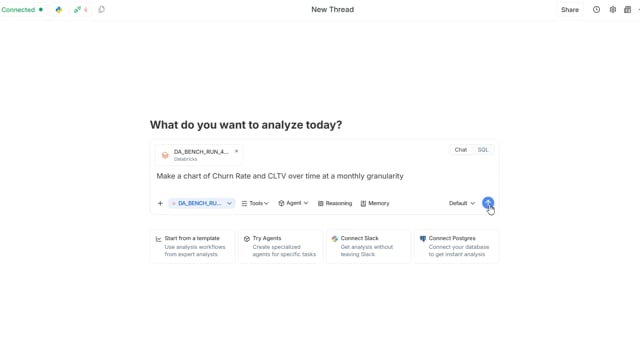
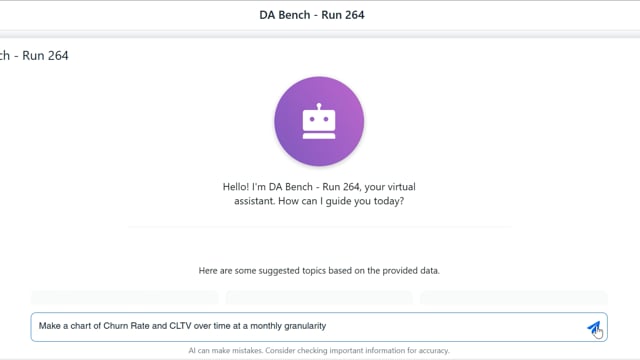
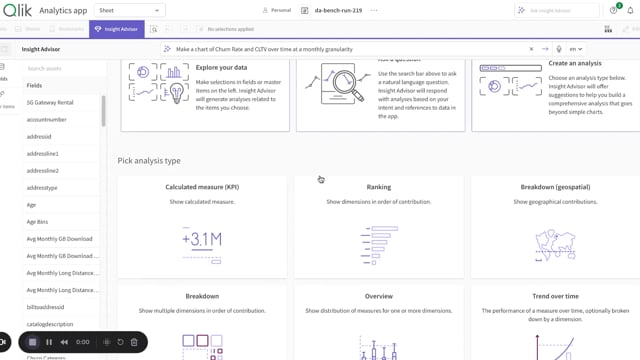
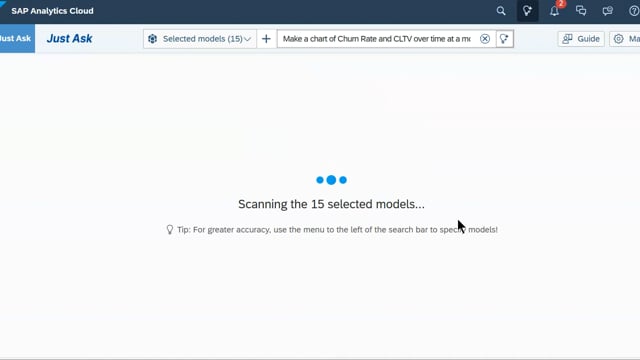
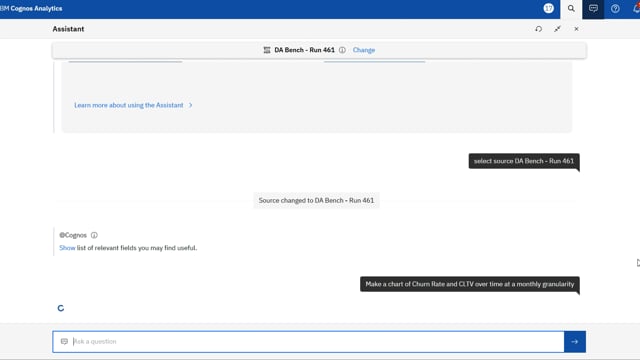
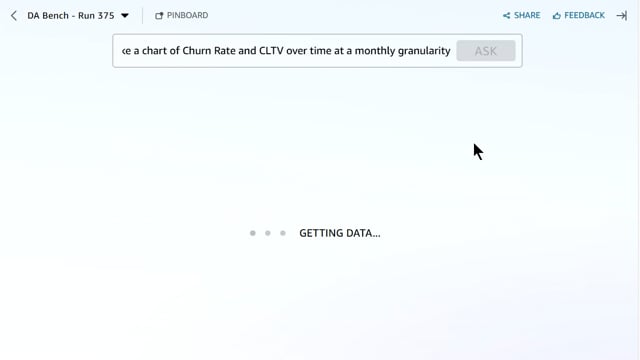
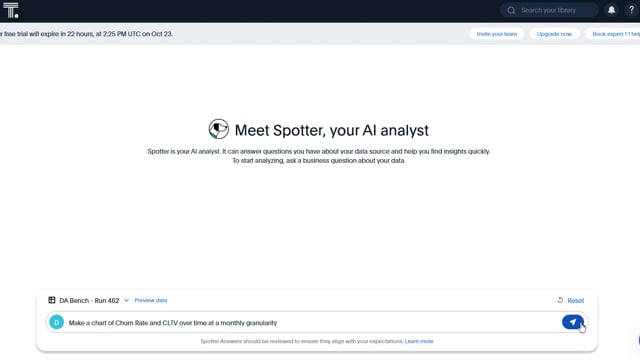
Prompt
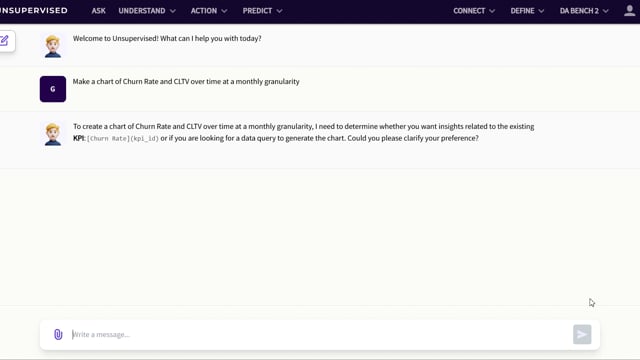
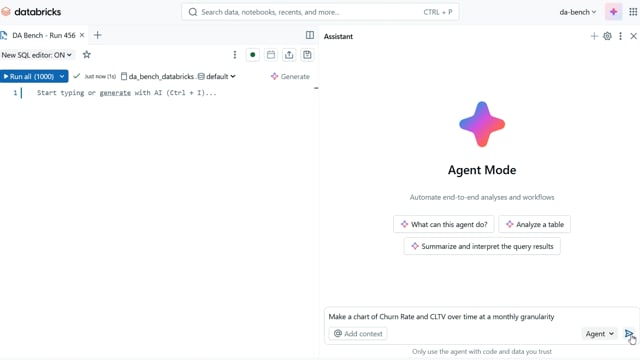
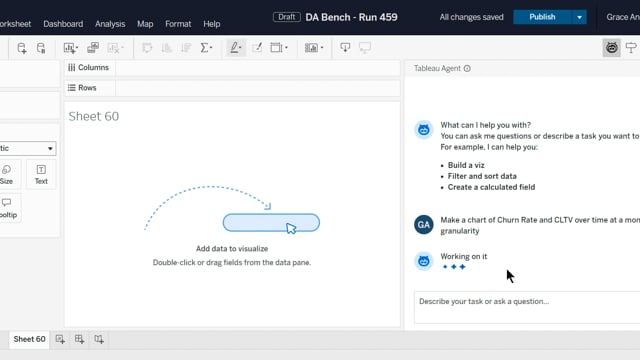
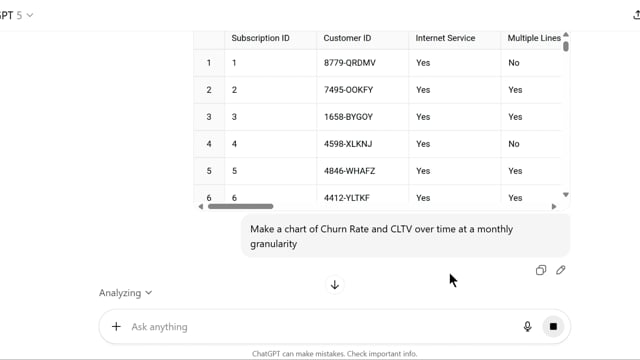
: Make a chart of Churn Rate and CLTV over time at a monthly granularity
Category
:
Datasets
: Telco
Latest Results
Tool
Score
Timestamp
Video Recording
unsupervised
0
X
databricks
4
X
tableau
0
X
snowflake
4
X
chatgpt
4
X
julius
5
X
microstrategy
0
X
qlik
0
X
sap
0
X
ibm
0
X
quicksight
0
X
bigquery
4
X
genie
-5
X
cortex
0
X
spotter
0
X